
We can interpret data by assuming a specific structure of our outcome and use statistical methods to confirm or reject the assumption. The assumption is called a hypothesis and the statistical tests used for this purpose are called statistical hypothesis tests.
Whenever we want to make claims about the distribution of data or whether one set of results are different from another set of results in applied machine learning, we must rely on statistical hypothesis tests.
Hypothesis testing is a statistical approach that is used with experimental data to make statistical decisions. This is used to determine whether an experiment performed offers ample evidence to reject a proposal.
A Null Hypothesis implies that there is no strong difference in a given set of observations.
The basic assumption of a statistical test is called the null hypothesis, and we can quantify and interpret statistical measurements to determine if the null hypothesis should be accepted or not.
We are interested to learn whether there is an actual or statistically meaningful difference between the two models when choosing models based on their estimated skills.
Imagine that you and your friend play a game. If a coin lands on heads, you win $5 and if it lands on tails he wins $5.
Let’s say the first two coin tosses landed on tails, meaning your friend won $10. Should you be worried that he’s using a rigged coin? Well, the probability of the coin landing on tails two times in a row is 25% (see above) which is not unlikely.
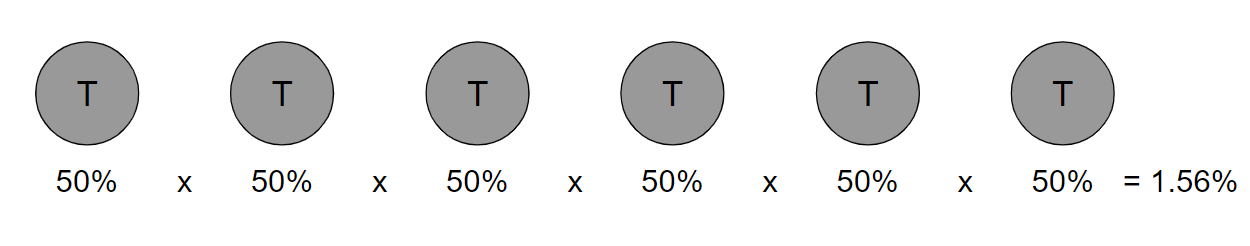
What if the coin landed on tails six times in a row? The probability of that occurring is approximately 1.56% (see above), which is highly unlikely. At this point, it would be fair to assume that the coin is rigged. Typically, one would set a threshold, usually 5%, to determine if an event occurred by chance or not (if you learned this before, this is known as the alpha!)
Now using the coin example again so that we can understand these terms better: